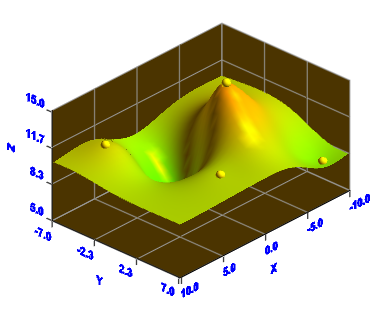
If surface or volume is defined by several scatter points, then the data of the points are called irregular data. For example, the following figure shows a surface defined by 5 scatter points, the data here are irregular. |
Download Visual Data today and start creating stunning scientific visualizations for your research and analysis.
